Editor's Note: This piece introduces Paul Mammino's xADREIP, a new way to assess potential busts or breakouts among relievers. To see the results of Mammino's research, and identify possible sleepers who can help win your league, go to SportsLine.com right now. Use promo code 'SCORE' for half off the first month of your SportsLine.com subscription to access that and more exclusive content.
To state the obvious, the role of the relief pitcher has changed drastically in the past few seasons. Some teams are no longer automatically using their best arm as the closer, while others are even going to a closer by committee.
While this may be the most logical and effective use of the elite arms that populate today's bullpens, it's an incredibly frustrating trend for Fantasy owners. In most leagues saves are still a category, and as a result they are something we cannot ignore. Some leagues have responded to the changes by adding Holds as a category, adding holds to saves, or going to even more extreme calculations like Sv*2 + H.
For all Fantasy players at this point, relievers cannot be ignored. Relief pitching and its highly volatile nature has been a particular interest of mine for a while, dating back to when Zack Britton was being discussed as a possible Cy Young candidate. I believed that we did not have an appropriate way of valuing his contributions since much of what relievers bring to a roster is very context specific.
As a result, I set out to develop a metric that captured the value of a reliever better than standard WAR and better than WPA, which I believed overvalued closers. I ended up using RE24, which is a metric that uses base-out stats to provide a number of runs saved by a particular pitcher, and weighted it with gmLI, which is the average leverage index of the situation when a pitcher enters the game.
I believe that the most valuable relievers are not the ones brought into clean innings, but the ones who are brought in to clean up the messes of others. However, in order to better work with this figure, I indexed gmLI to the average value for all relievers in that given season. In 2018, the league gmLI was 1.12, so if a pitcher had a gmLI of 1.5, his RE24 would be multiplied by 1.34, meaning he entered in situations 34 percent more intense than the average reliever. This value is divided by IP to provide me with a per inning rate. Below is the top 10 for 2018 min 40 innings.
| Name | Team | ADREIP |
| Blake Treinen | Athletics | 0.6146 |
| Jeremy Jeffress | Brewers | 0.5426 |
| Jose Leclerc | Rangers | 0.5355 |
| Sean Doolittle | Nationals | 0.5137 |
| Craig Kimbrel | Red Sox | 0.4407 |
| Edwin Diaz | Mariners | 0.4092 |
| Kirby Yates | Padres | 0.391 |
| Pedro Strop | Cubs | 0.3781 |
| Jared Hughes | Reds | 0.3766 |
| Adam Ottavino | Rockies | 0.3627 |
For the most part this chart tends to mesh with our beliefs and valuations of the top relievers in the game. However, there are few surprises, most notably Jared Hughes. Now how does this help us with Fantasy? Overall among the top 70 relievers on ESPN's player rater, the correlation between my ADREIP and their rating was 0.5. That means that if a pitcher rates well in my system he likely returned solid value in Fantasy. Relievers are notably a volatile bunch -- performing well in one year does not mean the next year will be the same; I like to call this the "Fernando Rodney Rule."
Over the years I have attempted to determine the underlying metrics that best correlate to success in high leverage bullpen roles. I was lucky enough to present some of my preliminary research at SaberSeminar in 2017. To do this I took all reliever seasons from 2012-2017 of over 40 innings and an adjusted gmLI of 1.2 or more. This gave me a sample 360 of pitcher seasons, which averages to two per team per year. Then I used these to run a regression model on a number of metrics that explain the below five skills I considered to be significant to late inning success:
- Swing and Miss: Often relievers enter the game with runners in scoring position, and being able to generate a strikeout is vital to keeping that runner off base
- Limit Free Passes: Self-explanatory, but it is difficult to string hits together, so not giving away free bases is massive
- Limit Extra-Base hits: Again it is difficult to string multiple hits together at any one time,so limiting the hits you do allow to only singles is extremely important in making it harder to score
- Generate Groundballs: Ground ball double plays can immediately erase a hit and make life on the pitcher much easier. Also, it is harder to hit grounders for extra bases, which ties into No. 3
- Platoon Neutrality: In later innings teams are much more willing to use a pinch-hitter and their bench in general, meaning it is likely the starter faces a number of opposite-handed hitters
I eventually settled on one metric per grouping, although my initial research did not include any platoon metrics. I expanded the equation to include a platoon score I developed which improved the results. Looking at 2018 here are the top 10 based solely off these skills.
| Name | Team | xADREIP |
| Sean Doolittle | Nationals | 0.5474 |
| Blake Treinen | Athletics | 0.5 |
| Edwin Diaz | Mariners | 0.4384 |
| Jose Leclerc | Rangers | 0.3545 |
| Josh Hader | Brewers | 0.3484 |
| Kirby Yates | Padres | 0.3263 |
| Will Smith | Giants | 0.3199 |
| Seranthony Dominguez | Phillies | 0.3125 |
| Ryan Pressly | - - - | 0.3103 |
| Scott Oberg | Rockies | 0.3059 |
We see several names that appear on both lists and a few new ones as we see that my model actually believes in the sustainability of the success of a different Rockies reliever in Oberg, even though Ottovino just signed a massive deal. A positive on the model is that it actually correlated slightly better than the results based ADREIP with the player rater even though the difference was minor. While the results were satisfying and the metric suggested a few pitchers to be cautious of from 2017-2018 (most notably Corey Knebel),I felt it did not do a great job of conveying the risk associated with certain pitchers.
We are always wary of small sample sizes and the flukes that can occur with a single season, and relievers operate within even smaller samples themselves. Most reliever seasons are only 60-70 innings, pitching one inning at a time. A poorly timed walk and home run can make an appearance seem worse than it really was. So in order to combat this, I felt that a singular value did not paint the appropriate picture of each arm. I decided to move from a regression model and work off a comparison-based system using Mahalanobis comps. What this provided me was a probability spectrum for each individual pitcher. Showing me just how volatile their individual profile is. Take this below example, which looks at Edwin Diaz and Blake Treinen:
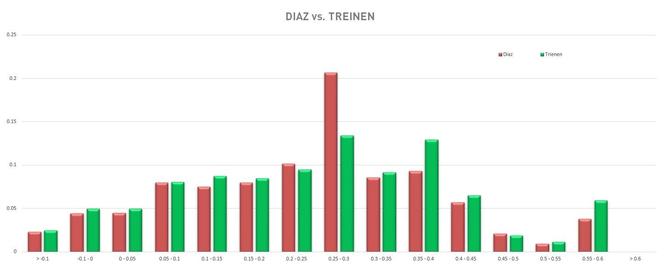
The chart shows the probability based off the closest comps that each pitcher falls within the different groupings of ADREIP -- 0.20 is around average for the sample I worked with. So what we can see is that Diaz seems to be "safer." He has a higher probability within the groupings considered to be average 0.20-0.30, and for the most part has a lower probability in each group towards the left of the graph. However, Treinen has the higher chance of a truly elite season, exceeding Diaz at essentially every tier greater than 0.3. Within the sample, only eight seasons have exceeded 0.55, and Treinen has a greater than five percent chance of reaching those heights.
For Fantasy, context matters, but both should be pitching for Wild Card contenders and should get plenty of save opportunities. According to NFBC data, Diaz is going ahead of Treinen in terms of ADP right now (47.23-62.79) since Jan. 1. Choosing between them is partially personal preference, but there is an interesting thought experiment between chasing the upside of Treinen or taking the floor of Diaz. Personally, based on Treinen being taken around one round later on average, I want to chase the upside with Treinen. There is still a high enough floor for the Athletics closer that the upside easily outpaces the risk for me.
Going forward, I will be using my probabilistic model to compare a number of different relievers within ADP tiers as evaluating the contenders for many of the most interesting Spring Training bullpen battles. Additionally, I will be using it to try to determine some under the radar holds targets and some interesting arms who could be extremely successful if they were to find themselves in the closer's chair. If you have any battles in particular you would like for me to evaluate, feel free to reach out on Twitter and I will be happy to help or could turn it into a future article topic.