Editor's Note: This piece introduces Aaron Sauceda's ACES metric, a new way to assess pitchers by their stuff, and a new way to find Fantasy values or potential busts. All of Aaron's exclusive content will be available at SportsLine.com this season. To see the full results of this metric, go to SportsLine now, use promo code "SCORE" to get half off all of their exclusive Fantasy content now.
Stuff. Pure, raw, unadulterated stuff. It's one of the driving forces behind the 100,000-plus eyeballs that flock to the GIFs of Rob Friedman's @PitchingNinja Twitter account. I mean, look at this:
Lance McCullers, Filthy 3 Pitch K Sequence (two curveballs on the black...and a nasty backdoor 2 seamer). 🤢 pic.twitter.com/nfeX1LpdwR
— Rob Friedman (@PitchingNinja) March 6, 2018
How human beings are able to throw a baseball that fast with that amount of movement with that level of precision — and then hit it! — is something I'll never know.
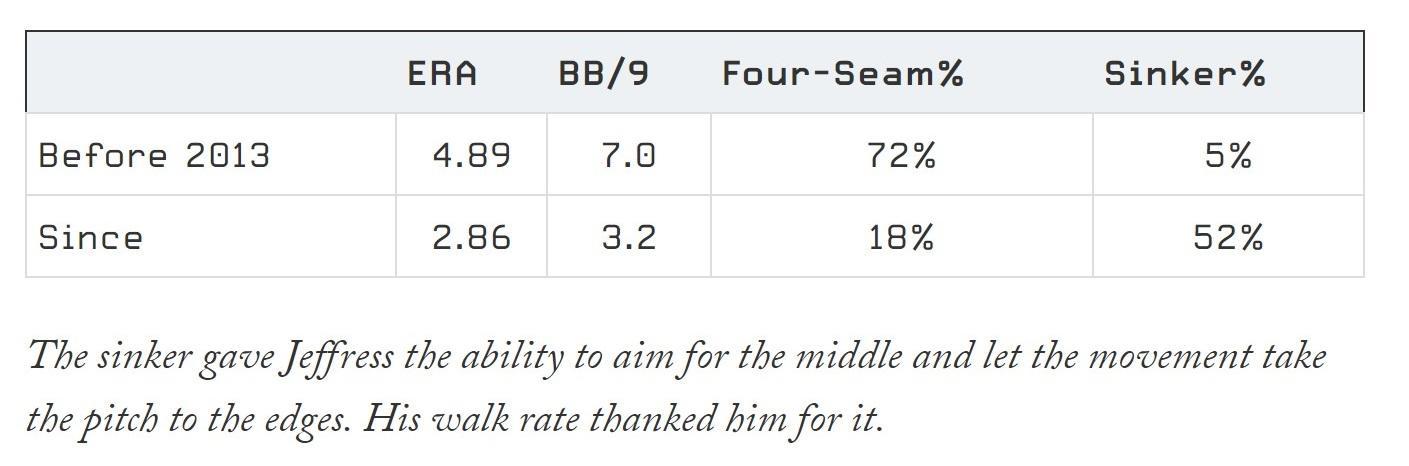
Since reading Eno Sarris' interview with Jeremy Jeffress last all-star break, this quote in particular has stuck with me:

You catch that? Jeffress said "…movement messes with the hitters" and "…hitters can't stand movement."
And look at his results before and after he tweaked his approached:
Looking at the McCullers' GIF above, it makes intuitive sense why hitters hate movement. Add velocity and the ability to locate the ball and it's easy to understand why it's difficult to hit the ball well.
That got me thinking: what if we forgot about the outcomes and results of each pitch? What if we evaluated pitchers based solely on their raw stuff?
CONTEXT: A NOD TO ARSENAL SCORES
If this sounds eerily similar to the concept of arsenal scores — you're right, it is. Popularized by Sarris in 2013-2014, and evolved by FanGraphs' Daniel Schwartz, Alex Chamberlain and Rylan Edwards since, arsenal scores assess a pitcher's repertoire by grading each pitch based on their whiffs and desired batted balls (e.g., grounders and popups) — then weighting each pitch's grades by pitch frequency to determine the overall best arsenals.
The idea was to more quickly separate the signal from the noise by focusing less on PA-level outcomes (e.g., BABIP, slugging, etc.) and more on pitch-level components — more whiffs, grounders and pop-ups equate to a better arsenal, so the thinking goes.
While there is certainly value to this approach, if we're trying to move away from outcomes and more toward year-to-year reliability, using batted balls such as grounders and popups can still leave us prone to volatility. And is using whiffs and grounders truly a reflection of raw stuff?
ENTER: 'ACES'
Going back to our original question: instead of looking at outcomes-based stats such as whiffs or grounders, what if we instead assessed pitcher arsenals through the lens of their raw stuff? In other words, we'll only assess a pitch's "ingredients" — velocity, movement and command. That is what Jeffress is referring to in his adjustments. And that is what drives eyeballs to the nasty GIFs on Friedman's Twitter account.
We'll call these Arsenal Combination Estimate Scores or, more succinctly, ACES.
We've had velocity and movement data widely available since PitchF/X was introduced in 2007. However, the elusive piece to date has been command. That may not be the case anymore. With the introduction of a promising new Command+ metric from STATS, Inc., we now have two seasons worth of pitch-level command data. This is huge, arguably the missing link of previous whiffs-focused assessments.
With quality velocity, movement and command data now at our disposal, we're well equipped to help answer who has the best raw stuff. But as with any new analysis — particularly in today's hyper information age — we should first be asking ourselves how this will provide an edge beyond existing metrics today. After all, there are so many different data points and stats to consider, we need to be diligent in using only the very best ones.
ASSESSING THE VALUE OF 'ACES'
To help answer this question, there are three primary aspects to consider:
- How sticky or reliable is the metric year-to-year?
- How well does the metric explain or describe things we care about?
- How good is the metric at predicting things we care about?
1. IS ACES STICKY/RELIABLE?
To quantify this, let's assess the year-to-year volatility of our raw stuff ingredients, as measured by the r-squared ("r^2") between the metric in one season ("season Y") versus the same metric in the next season ("season Y+1").
You can think of r-squared like a percentage grading scale from 0-100, with zero being the worst and 100 being the best. In this case, bigger values are better. Zero means there is no relationship between two variables from one season to the next. A one means there is a perfect relationship. The closer to one, the stickier a stat is. If a stat is sticky, we're more confident a player — in this case, a pitcher — is more likely to display this skill in the following season.
Now look at how reliable a pitchers' stuff is year-to-year at the per-pitch level, despite the small sample (20 innings pitched):
Metric | R^2 |
Velocity | 0.81 |
Horizontal Movement | 0.89 |
Vertical Movement | 0.71 |
- Source: FanGraphs
- N = 3,911 season pairs, min. 20 IP in each season (2007-2018)
- Note: Analysis done at pitch level, averages across pitches shown above; Used 2007 as a cutoff due to it being first year data was available for movement and velocity
It's too early to say for command — the new Command+ metric has existed only for two seasons — but initial testing shows a strong year-to-year relationship, even if not quite as strong as velocity and movement.
And when combining those elements into our ACES metric — see the methodology included at the end of the piece for the details on how it's calculated — we see a very strong year-to-year relationship.
Again, it's only two seasons worth of data, but these initial tests showed promising results:
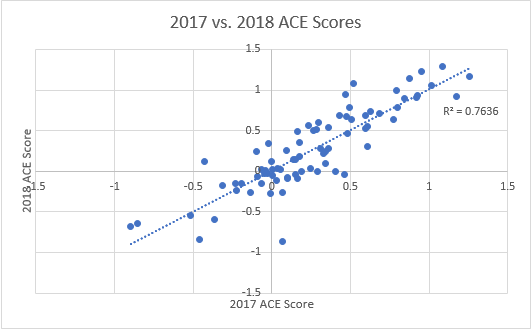
(NOTE: Only includes pitchers who threw each pitch in their arsenal at least 50 times; n = 78 season pairs)
Look at that 0.764 r-squared. This is among the strongest year-to-year relationships I've seen across any metric in baseball (small two-season sample caveat applies).
I think it's fair to say that if a pitcher possesses a strong arsenal in one season — as judged by velocity, movement and command — it's quite likely that he'll possess a strong arsenal the next season (or vice versa). It may not be the most statistically pure definition, but you can also interpret the r-squared in the following way: 76 percent of this season's ACES metric can be explained by last season's ACES metric.
Contrast that with other metrics often used in pitching analysis such as, say, ERA, which has a much weaker year-to-year relationship — this time in a larger sample of 150 innings pitched:
Metric | R^2 |
GB% | 0.63 |
K% | 0.62 |
SwStr% | 0.62 |
BB% | 0.46 |
Pitch Values | 0.10 - 0.22 |
ERA | 0.11 |
HR/FB | 0.11 |
BABIP | 0.04 |
LD% | 0.03 |
LOB% | 0.02 |
- Source: FanGraphs
- N = 627 season pairs, min. 150 IP in each season (2007-2018)
While whiffs (K% and SwStr% used as proxies) and grounders (GB%) appear sticky, using a pitcher's raw stuff is anywhere from 13-41% stickier year-to-year (despite testing with a fraction of the sample). This table also shows why we're collectively fading pitch values and other volatile ERA-related metrics.
While ACES appear superior in stickiness, do they help us better understand who the best pitchers are?
2. ACES' RELATIONSHIP WITH PRODUCTION
There is plenty of room for improvement here, but the initial answer is a cautious "yes." Comparing against preliminary testing of previous arsenal score iterations, ACES appear approximately 1.5-2x more descriptive of results:
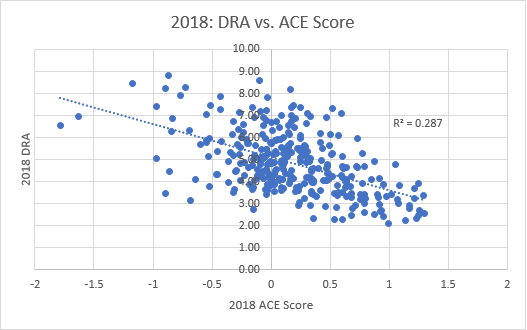
There's a meaningful relationship between ACES and Baseball Prospectus' DRA metric — typically, the higher your ACES metric, the lower your DRA. That's good to know as that's ultimately a key piece of what we're hoping to predict! I used DRA as a proxy for ERA because it's more predictive of future ERA than ERA itself and more reliable year-over-year. For the sake of this analysis, we'll use DRA and ERA interchangeably — that is, if ACES correlates to a lower DRA, it also correlates to a lower ERA.
Also of note, we see an even stronger relationship between ACES and other ERA estimators such as SIERA, FIP and xFIP (0.35 to 0.37 r-squared).
Of course, while this is all great to know, do they help us predict anything meaningful?
3. PREDICTIVE UTILITY OF ACES
Despite using zero components of run production, ACE Scores appear adept at predicting future ERA — better than ERA itself and similar to projections and ERA estimators (perhaps within the margin of error):
Metric | r^2 |
SIERA | 0.193 |
xFIP | 0.183 |
FIP | 0.174 |
ACE Score | 0.164 |
0.160 | |
ERA | 0.108 |
This is a huge point. Despite incorporating nothing more than velocity, movement and command, we're able to credibly predict next season's ERA in line with projections and estimators designed to predict it. This is all while being much stickier year-to-year. At risk of repeating the "small sample" warning again, more seasons worth of data and rigorous testing is needed. But based on what we have, ACES appears to warrant a place in your pitcher evaluation toolbox.
So how should we be using ACES?
HOW TO APPLY FINDINGS
As Sarris and Chamberlain have stressed in the past, I want to re-iterate that this isn't necessarily meant to be a mathematically rigorous exercise that unequivocally helps identify the best pitchers. There are certainly limitations and areas to improve.
That said, I do believe it's a useful and reliable piece of the evaluation puzzle. Here are a few examples on how we can incorporate ACES into our Fantasy process:
- Fading expensive ADP pitchers who don't possess a strong ACES metric
- Differentiating as a "tiebreaker" between two similarly valued and liked pitchers
- Validating a previous season's breakout (at least to some degree)
- Identifying inexpensive or "free" ADP pitchers who have strong stuff
Perhaps just as importantly, I am not using it as the sole tool to create 2019 pitcher rankings, but rather using it as another input into that process — in particular, I think it's best used as a tool in conjunction with projections and other sticky and predictive stats (e.g., K%, K-BB%, DRA, SIERA, etc.).
Lastly, don't forget to consider other "macro" factors that matter for Fantasy but are more challenging to incorporate into projections and the ACES metric: expected wins of a pitcher's team, team defense, home park, difficulty of division, expected catcher framing, etc.
RESULTS
If you've stuck with me so far through 1,000-plus words, finally, the moment we've been waiting for — who has the best stuff!?
To illustrate a pitcher's depth of arsenal, I've also shown who threw at least three pitches more than 10% and 20% of the time — analysis by Mitchell Lichtman has shown that's effective in reducing the times through the order (TTO) penalty. I've also shown the number of plus pitches, which I've classified as one standard deviation above the mean.
Based on this methodology, here are the top 10% of arsenals from 2018 (the full list is available at SportsLine.com):
This list is littered with elite guys. Thor is perhaps the posterchild for this sort of analysis, with the wicked velocity and movement he has on his pitches. In addition to him scoring at the top with fellow velocity and movement wiz Gerrit Cole, we see many names we'd expect here — Verlander, Severino, Sale, deGrom, Snell, Paxton, Strasburg, Nola, Buehler, etc. That gives us a semblance of confidence in the methodology.
Then again, we're not looking at this analysis to tell you they're good. It's the other names on this list that drive intrigue, many of whom are already popular sleepers among Fantasy analysts (Josh James, Nick Pivetta). Others might suggest confidence in 2018 "breakouts," whichever flavor it may have come in (Zack Wheeler, Charlie Morton, Jameson Taillon, Walker Buehler). The top 10% is rounded out by other names that are difficult to quit (Luis Castillo, Michael Fulmer) and just plain shockers (looking at you, Jordan Lyles and Kendall Graveman).
KEY TAKEAWAYS AND NEXT STEPS
We're barely scratching the surface here — there are many additional offshoots of analysis we can conduct. In future iterations, we'll assess things such as our favorite late buys this 2019 season, biggest improvers from 2017 to 2018 and more. We've also included the full data set for you to play around with — we'd be interested in knowing how you're using it and what additional analysis could be interesting and useful!
In the meantime, let's recap what we've learned:
- The ACES metric is among the stickiest year-to-year metrics to use (r-squared between ACE Score 2017 to 2018: 0.764) — looking at a pitcher's raw stuff (velocity, movement and command) may be our best bet at understanding their true talent level.
- Generally, the better the ACES metric the lower the DRA/ERA (r-squared with DRA: 0.287).
- Despite only incorporating velocity, movement and command, ACES are more predictive of future ERA than ERA itself, and in line with existing projections and estimators.
- More seasons worth of data and additional rigorous testing is needed to further validate the above findings.
WHERE DOES 'ACES' GO FROM HERE?
There's certainly room for improvement as there are other factors that drive performance that aren't captured here, but it appears we have at least a rudimentary tool that helps us understand the quality of stuff a pitcher possesses.
However, there is still much more work to be done — I'm hoping this is just the first step in continuing to evolve pitcher evaluation. Perhaps we could further improve this analysis by incorporating select outcomes data that has tested as very sticky — maybe that's whiffs and certain batted balls. We'll leave that for future testing and improvements.
On that note, I've taken an initial pass at what I think could be some interesting questions to explore further — consider the following key questions areas for further evolution:
- Can ACES be improved by incorporating an element of outcomes – whiffs, batted balls, etc.? Would it be "double counting" to include that and raw stuff, which presumably drives those outcomes?
- How important are each of velocity, movement and command? How should they be weighted? How should that differ by pitch, if at all? (See "A Note on Weightings" below for current weights)
- Is there a way to incorporate other elements of a pitcher's stuff and which would be the most crucial to add? (e.g., tunneling, deception, etc.)
- Should we split lefties and righties? If so, how should the analysis differ for each, if at all?
- Is all movement created equal (e.g., horizontal vs. vertical)? How should that differ by pitch, if at all?
- Should each pitch be weighted by frequency thrown? Are some pitches more important than others that aren't being effectively captured by using current pitch mix?
- How to assess specific "arsenals" or "combinations" of pitches? (e.g., is certain fastball-changeup movement best? Is it better to be a four-seam/slider/changeup pitcher than two-seam/curve/changeup?) Are two elite pitches better than four average pitches?
- As we collect more seasons worth of data, how reliable does ACES remain year-over-year? How predictive are they towards stats we care about? (e.g., future ERA, etc.)
In the meantime, stay tuned for additional analysis to follow on how we can apply these findings and use ACES to identify edges this upcoming season.
ACKNOWLEDGEMENTS & RESOURCES
This absolutely could not have been completed without the willing help and time of Eno Sarris and the STATS team. Closely following Eno's work for years guided the thinking and when I cold-email pitched this idea to him, he was excited and completely on board. Not to be outdone, the missing link was the pitch-level Command+ data, which the STATS team willingly provided to myself and Eno — the results were surely enhanced by its inclusion.
Additionally, there were other resources leveraged that were invaluable for this research — several of them are linked throughout the piece, but also included here for reference:
- Previous Arsenal Score Work:
- 12/16/14 (Eno Sarris) – Intro to Arsenal Scores: https://fantasy.fangraphs.com/toward-a-pitch-arsenal-score-ranking-statistic/
- 12/19/14 (Daniel Schwartz): https://fantasy.fangraphs.com/pitch-arsenal-score-part-deux/
- 2/2/16 (Eno Sarris): https://fantasy.fangraphs.com/the-change-arsenal-scores/
- 1/17/17 (Alex Chamberlain): https://fantasy.fangraphs.com/2016-weighted-arsenal-scores/
- 6/7/17 (Rylan Edwards) – Midseason Arsenal Scores: https://fantasy.fangraphs.com/mid-season-arsenal-scores/
- Rob Parker – Assessing Arsenal Scores: https://community.fangraphs.com/evaluating-the-eno-sarris-pitcher-analysis-method/
- Eno Sarris – Introduction of STATS Command+: https://theathletic.com/346863/2018/05/10/exclusive-a-big-step-forward-in-measuring-command/
- What Makes a Good Changeup (2013, Harry Pavlidis):
- https://www.baseballprospectus.com/news/article/20539/what-makes-a-good-changeup-an-investigation-part-1/
- https://www.baseballprospectus.com/news/article/20696/what-makes-a-good-changeup-an-investigation-part-two/
- https://www.baseballprospectus.com/news/article/21675/what-makes-a-good-changeup-an-investigation-part-three/
- Saber Seminar: https://legacy.baseballprospectus.com/u/files/What%20Makes%20a%20Good%20Change%20Up%20-%20Pavlidis%20Saber%20Seminar%202013.pdf
- Pitch-Level Research:
- Eno Sarris - Average movement for each pitch: https://fantasy.fangraphs.com/the-change-average-movement-for-each-pitch-type/
- Eno Sarris - How valuable is each pitch? https://blogs.fangraphs.com/instagraphs/is-the-fastball-less-valuable-than-we-thought/
- https://www.foxsports.com/mlb/just-a-bit-outside/story/not-every-pitcher-needs-a-changeup-011915
- https://www.foxsports.com/mlb/just-a-bit-outside/story/best-curveball-corey-kluber-felix-hernandez-craig-kimbrel-jose-fernandez-020215
- Thomas Karakolis: Velo, movement or location? https://www.fangraphs.com/community/what-is-more-important-for-a-fastball-velocity-location-or-movement-2/
ACES METHODOLOGY
This piece was already long without including the methodology, but for those interested, I've included the ACES calculation process below. Hat-tip to Sarris and predecessors, as the methodology is eerily similar to previous arsenal score iterations:
- Pulled 2018 PitchFX data for each pitch type from Baseball Prospectus leaderboards for velocity, horizontal movement and vertical movement (NOTE: min. 50 pitches thrown — this may exclude less frequently thrown pitches of those who pitched few innings last season; excluded knuckleballs and screwballs)
- Included only starting pitchers who pitched at least 20 innings (n = 240 for 2017, n = 250 for 2018)
- Utilized STATS Command+ metric to measure command
- Within each pitch type, calculated each pitcher's z-score for velocity, movement and command and summed them using a 50% (velocity), 25% (movement) and 25% (command) weighted scoring system* (NOTE: For changeups, I used the z-score for whichever scored highest — either a power change with velocity, movement and command or a change with strong fastball-changeup velocity gap)
- Weighted the z-scores by pitch mix frequency and added the weighted z-scores to create each pitcher's ACE Score
- Z-score calculation assumptions:
- More velocity and more command is better (higher velocity gaps between fastball and changeup is assumed to be better)
- Vertical "drop" (i.e., lower number) is good, except for four-seamers (assumed "rise" is better, i.e., higher number)
- Absolute horizonal movement is good, whether arm-side or glove-side (i.e., higher number)
- A NOTE ON WEIGHTS: This is admittedly more art than I'd prefer, but determining how important each of velocity, movement and command are towards the success of a pitch isn't a trivial question. Previous analysis by Sarris found that whiffs were roughly two times more correlated with ERA estimators than grounders. Additional analysis on the best curveballs found that velocity was the key for whiffs while drop was the key for grounders. Based on those findings, it appears we should weight velocity two times more than movement. FanGraphs community research found similar importance of velocity. This is where the "art" came in, using the following weightings: 50% velocity, 25% movement (12.5% horizontal and vertical each) and 25% command. This might be the key question to answer to further improve this analysis.